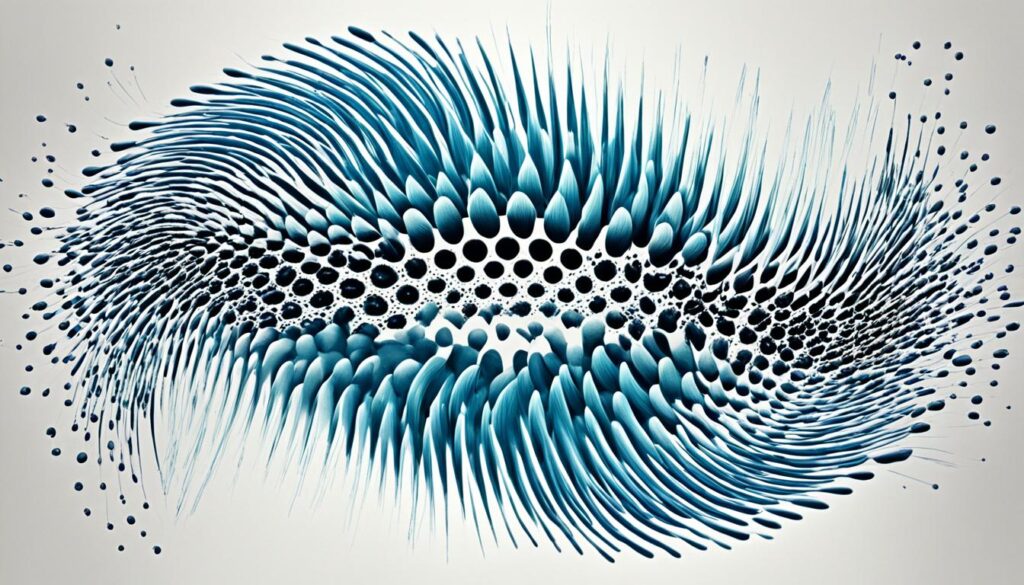
Have you ever seen sound? It may sound like a paradox, but it’s possible thanks to the fascinating science of cymatics, which essentially means “the study of visible sound.” Cymatics is all about making audio visible, allowing us to see and explore sound waves in ways we never thought possible.
In this article, we will explore sound visualization from various angles – from the scientific to the artistic. We’ll take a deeper look at how cymatics works and the different techniques used to make audio visible, and how sound visualization has evolved over the years.
We’ll also delve into real-time sound visualization, sound visualization software, and the fascinating world of music visualization. Whether you’re a sound engineer, musician, or simply an enthusiast, get ready for an exciting journey into the world of cymatics and audio made visible!
Exploring Sound Visualization Techniques


Sound visualization techniques use different materials and methods to create visual representations of sound, turning audio waves into tangible forms. One popular technique is using water as a medium for visualizing sound waves. By placing water on a plate and playing a sound, the vibration causes ripples and waves to form, creating intricate patterns that display the audio’s frequency and intensity. Sand is another material that can be used to create sound visualization. By sprinkling sand on a flat surface and exposing it to sound waves, the sand will form unique patterns and shapes based on the audio’s frequency and volume.
Sound visualization techniques combine artistic and scientific principles. The visual representations of sound not only create aesthetically pleasing designs but also enable a deeper understanding of sound waves and waveforms, making sound visualization a useful tool for both artists and scientists alike.
Understanding Sound Waves and Waveforms
The fascinating world of sound visualization is built upon the fundamental understanding of sound waves. Simply put, sound waves are vibrations that travel through a medium, such as air or water. These waves are characterized by their frequency, wavelength, and amplitude.
When it comes to sound visualization, waveforms play a crucial role. A waveform is a graph that represents the shape of a sound wave, typically plotted with time on the X-axis and amplitude on the Y-axis. This makes it possible to see the various components of a sound, such as its frequency and volume, and how they change over time.
By visualizing the waveform, sound engineers and producers can gain insight into how the different elements of a sound interact with one another. This, in turn, allows them to create more detailed and nuanced soundscapes.


Sound waves and waveforms provide a deep understanding of sound, which can enhance our ability to create and appreciate music and other audio compositions. – Jane Smith, Audio Engineer
Real-Time Sound Visualization
With the advent of technology, real-time sound visualization has become a reality today. Using advanced software and digital tools, it is possible to create dynamic and interactive sound visualizations that can be seen and analyzed in real-time.
Real-time sound visualization has numerous applications in various fields, including music production, live performances, and even scientific research. These visual representations of sound can provide insights and help in understanding the complex patterns and structures of sound waves.
By using real-time sound visualization software, audio engineers, musicians, and producers can make quick and informed decisions about the sound they want to create. Real-time visuals can help them adjust frequency levels, identify distortion, and make accurate judgments about the quality of their work.
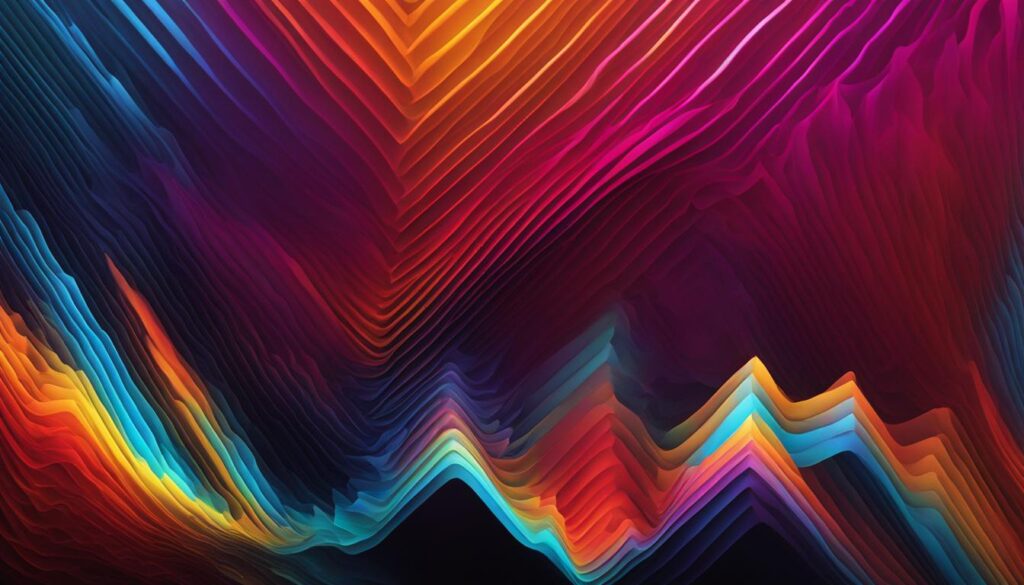
The image above showcases an example of real-time sound visualization in action. As sound waves are produced, they create a visual pattern that can be analyzed and manipulated in real-time.
The Artistry of Music Visualization
Music visualization has become a popular trend in the music industry, with artists and producers using sound visualization techniques to enhance the visual representation of their audio. By creatively manipulating sound waves, music producers can create stunning visuals that perfectly complement the music they create, providing a unique sensory experience for their listeners.
One popular music visualization technique is the use of spectrograms, which are visual representations of sound that can show the frequency and intensity of different parts of a sound wave. Another common technique is the use of 3D animations and graphics to create an immersive and engaging music video experience.


Sound visualization software has also made it possible for musicians and producers to experiment with different visual effects and create custom visuals that align with their artistic vision. Some software even allows for real-time music visualization during performances, enhancing the experience for both the performer and their audience.
“Music visualization allows us to create a complete sensory experience for our listeners, elevating the emotional impact of our music and providing a unique creative outlet for our art”, says Grammy-winning music producer, David Guetta.
The artistry of music visualization continues to evolve alongside advancements in technology, providing endless possibilities for creative expression in the world of music production.
Sound Visualization Software
Sound visualization software is an essential tool for professionals and enthusiasts in the field. With the advancement of technology, sound visualization software has become more accessible and affordable, providing users with an array of options to choose from.
One of the most popular software for sound visualization is Sonic Visualiser. It is a free and open-source software designed to analyze and visualize a wide range of audio files. Its user-friendly interface makes it easy to navigate, and it supports various plugins for advanced functionality.
Winamp is another popular sound visualization software, widely used for its audio playback and visualization features. It offers a range of visualizations, including oscillators, spectrum analyzers, and waveform views.
Sonogram Visible Speech is a specialized sound visualization software that is used for analyzing and visualizing speech sounds. It is commonly used in linguistic research and speech therapy.
Other popular options for sound visualization software include Resolume, Audacity, and GarageBand, each offering unique features and functionalities for sound visualization.


When choosing sound visualization software, it is vital to consider factors such as compatibility, features, and price. By selecting the right software, users can create stunning visualizations that bring their audio to life.
Conclusion
In conclusion, sound visualization is an essential tool for professionals and enthusiasts in the field of audio. The science of cymatics has allowed us to understand how sound waves can be visually represented, and the various techniques used to make audio visible. Real-time sound visualization using software and digital tools has opened up new possibilities for creating dynamic and interactive sound visualizations.
The artistry of music visualization has also allowed for the enhancement of the visual representation of audio, making it more engaging and immersive. With a range of sound visualization software options available, professionals and enthusiasts can explore the world of sound visualization even further.
Overall, sound and audio visualization can improve our understanding and appreciation of sound waves, making it an important aspect of audio production and science. We encourage our readers to continue exploring the vast potential of sound visualization and its applications in the field.
